Estimates the multifractal scaling properties of a time series using
the detrending moving average algorithm (Gu & Zhou 2010). Clean-room
C++ reimplementation from the published algorithm (the reference
MATLAB implementation consulted, MFDMA_1D.m, had no license header;
see inst/COPYRIGHTS). The segment-fluctuation core was validated
against a Python transliteration of that reference on synthetic test
data (exact match to displayed precision).
Usage
mfdma(
  x,
  n_min = 10L,
  n_max = NULL,
  n_scales = 30L,
  theta = 0,
  q = seq(-4, 4, by = 0.1)
)
Arguments
- x
Numeric vector. The time series to analyse.
- n_min, n_max
Integer. Lower/upper bound of the segment size
n. Following the reference implementation's guidance:n_minaround10;n_maxaround 10% oflength(x). Defaults:n_min = 10,n_max = round(length(x) / 10).- n_scales
Integer. Number of segment sizes to evaluate (log-spaced between
n_minandn_max). Default30.- theta
Numeric in
[0, 1]. Position of the moving-average window:0(default, recommended) = backward MFDMA,0.5= centered,1= forward.- q
Numeric vector. Multifractal orders to evaluate. Default
seq(-4, 4, by = 0.1).
Value
A list with:
- n
Segment sizes evaluated.
- Fq
Matrix of the q-th order fluctuation function (segment size x q).
- tau
Multifractal scaling exponent tau(q).
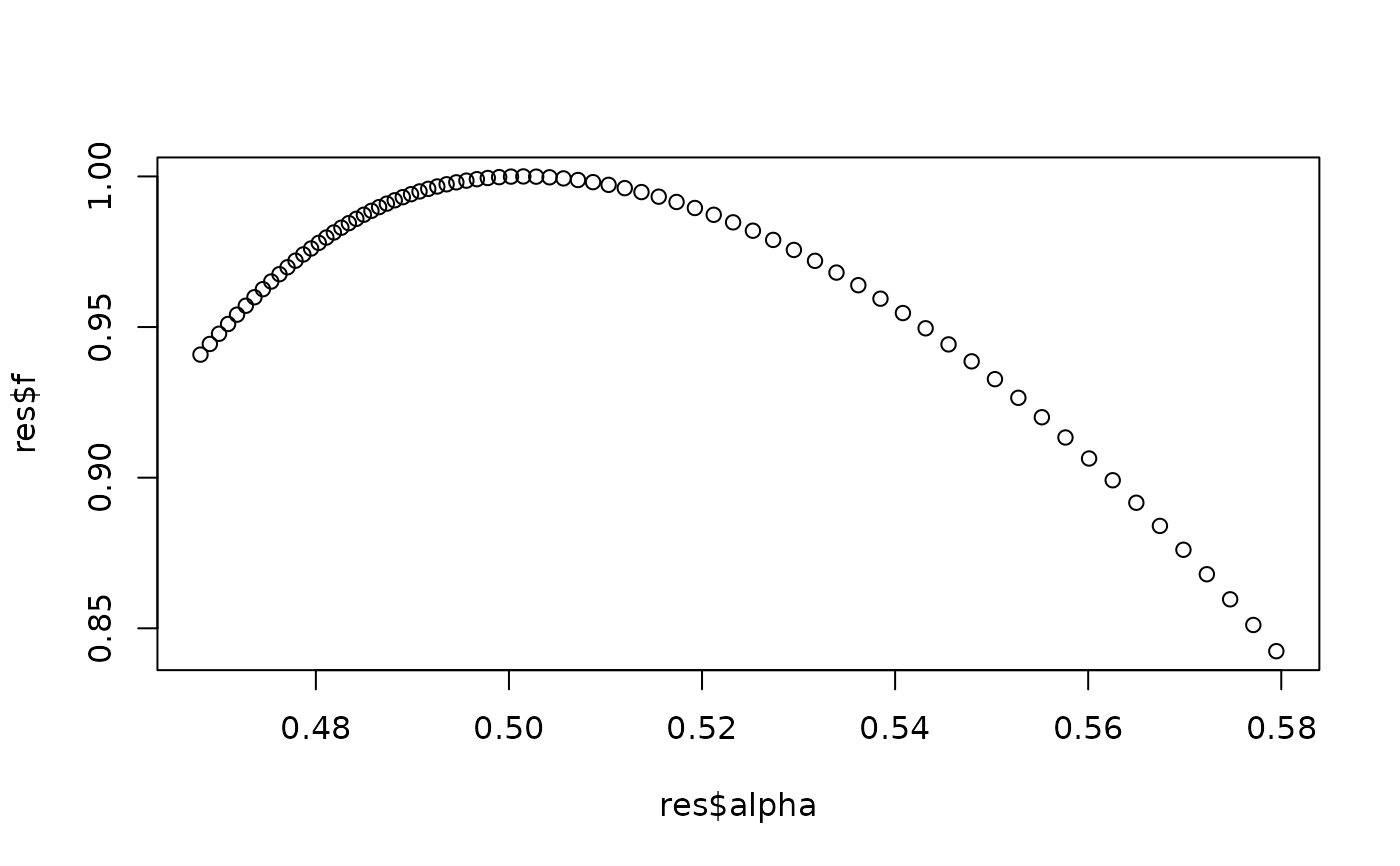
- alpha
Singularity strength alpha(q) (trimmed at both ends by the local-slope smoothing window; shorter than
q).- f
Multifractal spectrum f(alpha).
- q
The
qvalues corresponding toalpha/f(trimmed to match).