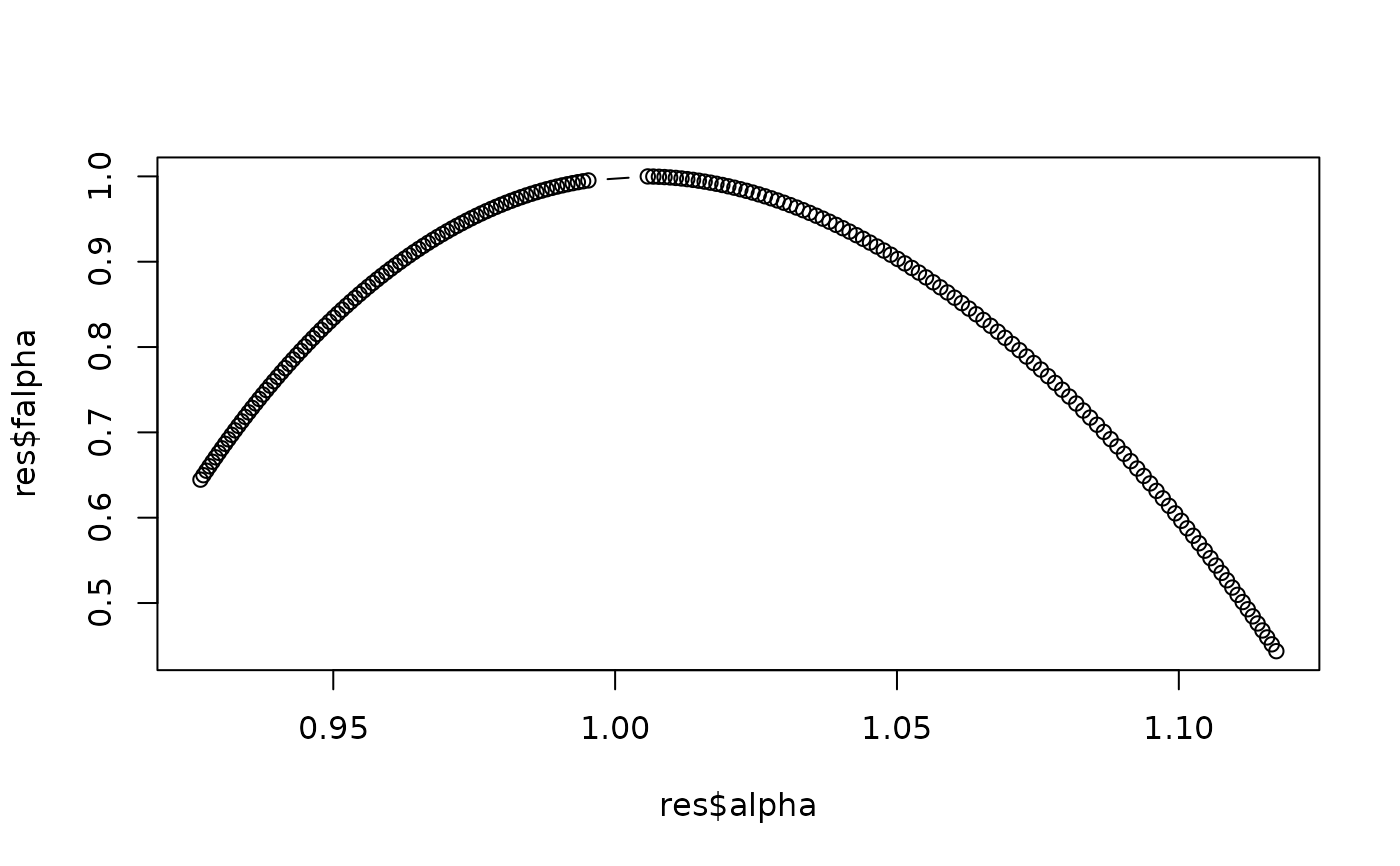
Estimates the multifractal spectrum f(alpha) and generalised dimension
spectrum D(q) of a strictly positive time series using the direct
box-counting method of Chhabra & Jensen (1989). Clean-room C++
reimplementation from the published algorithm (the reference MATLAB
implementation consulted, ChhabraJensen_Yuj_w0.m, co-authored by
L. Franca, had no license header; see inst/COPYRIGHTS). The moments
core was validated against a Python transliteration of that reference
on synthetic test data (exact match to displayed precision).
Arguments
- x
Numeric vector, strictly positive (treat it as a measure — e.g. apply a sigmoid transform first if your data can be negative).
length(x)must be evenly divisible by2^scalefor every value inscales, i.e. dyadic lengths (powers of two) work best.- q_values
Numeric vector of multifractal orders. Per the original author's guidance, values strictly between 0 and 1 (exclusive) are numerically unstable for this method and best avoided – a warning is issued if any are supplied. Default skips that range:
c(seq(-10, -0.1, by = 0.1), seq(1, 10, by = 0.1)).- scales
Integer vector of box-counting scale exponents; the box size at each scale is
2^scale. Default1:floor(log2(length(x)) - 2), which keeps at least 4 points per box at the coarsest scale.
Value
A list with:
- alpha
Singularity strength alpha(q).
- falpha
Multifractal spectrum f(alpha(q)).
- Dq
Generalised dimension spectrum D(q).
- r_squared_alpha, r_squared_falpha, r_squared_Dq
R-squared of the linear fit underlying each of the above, per
q– inspect these before trusting a given q value's estimate.- q
The
q_valuesused.- mu_scale, Ma, Mf, Md
The underlying regression inputs, included for completeness.
References
Chhabra A, Jensen RV. Direct determination of the f(alpha) singularity spectrum. Phys Rev Lett 1989;62:1327-1330.
Franca LGS, Miranda JGV, Leite M, Sharma NK, Walker MC, Lemieux L,
Wang Y. Fractal and multifractal properties of electrographic
recordings of human brain activity: toward its use as a signal feature
for machine learning in clinical applications. Front Physiol
2018;9:1767. Compares MF-DFA, MF-DMA, and Chhabra-Jensen on simulated
and human intracranial EEG data and finds Chhabra-Jensen the most
stable/reliable of the three – the basis for implementing this method
(rather than MF-DFA) alongside mfdma() in Rtractor.